


2025 WR Class: Final Pre-Draft Grades
The most difficult position to predict: Wide Receiver.

The 2025 NFL Draft is tonight and my third installment of my Pre-Draft positional grades are below. Today are the Wide Receivers.
Below is an in-depth explanation of my Pre-Draft Wide Receiver grades for the 2025 NFL Draft Class. For additional information regarding the Process’ General Overview and Model, take a look at my 2025 QB Class: Final Pre-Draft Grades post.
There are two things I want to call out before diving into the grades:
- My WR model only has two grades: Pre-Draft and Post-Draft. At this time, I have found no athletic measurable at the combine correlated to fantasy success.
- My WR model is arguably my worst model. After my QB and RB Pre-Draft Grades out-did NFL Draft Capital, my WR grades took a step back. WRs are difficult to predict - even NFL Draft Capital has the worst R-squared. If anyone knows of a good WR model, let me know. I’d love to dive in and learn from it.
As a reminder, for all positions, my model is trying to predict Weighted Points per Game (wPPG) for a player’s first three years. I am choosing to use wPPG model due to how reactionary dynasty fantasy football is becoming - if a player doesn’t perform early, managers become impatient, move on, and their value decreases. My formula for wPPG is below:
wPPG = (Yr1PPG * 45%) + (Yr2PPG * 35%) + (Yr3PPG * 20%)
The Wide Receiver’s Model’s Foundation
I analyzed players drafted from the 2017 to 2022 NFL Drafts. Each one of those players has had the opportunity to complete three NFL seasons. For the WRs, this resulted in a sample size of 180 players. I chose to only look back 5 five complete draft classes to ensure we are evolving with the NFL and, as I mentioned, “relevant” data sets.
Instead of forcing success based on linear improvement, I used Decision Tree Analysis to define thresholds for each input metric. A Decision Tree example was shown in 2025 QB Class: Final Pre-Draft Grades.
Key Reminders:
This decision tree approach helps us see that player success isn't always linear.
To make sure one stat doesn't overpower everything, I limit any single stat's influence to 20%.
Tiers for my model are Diamond, Platinum, Gold, Silver, and Bronze.
The real test? Using R2 to determine if my model is better at predicting than NFL Draft Capital alone.
Inputs and Results
For WRs, I used nine input metrics across three different categories:
Individual Performance
Career Yards per Team Pass Attempt
Breakout Age (20% Dominator)
Career Yards per Route Run
Best Season PFF Rec Grade
Best Season Missed Tackles Forced
Best Season Receiving Touchdowns (TDs)
Team Performance
Final Season Offensive Simple Rating System (Sports Reference)
Biographic Information
Age Drafted
Overall Selection
As previously mentioned, we will be comparing my model’s R2 for predicting wPPG to the R2 of NFL Draft Capital for predicting wPPG. R2 is measured from 0 (poor fit) to 1 (perfect fit). The goal is to beat NFL Draft Capital, not find a perfect fit. Results are below for Overall NFL Draft Selection and all of my grades (Pre-Combine, Pre-Draft, and Post-Draft)
Overall NFL Draft Selection vs Years 1-3 wPPG: .374 R2
Pre-Draft Grade vs Years 1-3 wPPG: .277 R2
Post-Draft Grade vs Years 1-3 wPPG: .418 R2
As you can see, my Pre-Draft Grades are not as good as NFL Draft Selection alone. As mentioned, WRs are difficult to predict. There are a lot of things that could contribute to this that can not (or at least easily) be factored in: level of play, scheme, competition within their own team just to name a few. For additional reading, take a look at the Treadwell-Diggs hypothesis. Partially joking, but who knows. My Wide Receiver model will be one of my main focuses going into the future.
Tiers and Grades
Let’s dive deeper into the grades, tiers, and the significance behind them.
Two things to note:
These are NOT my rankings. These are simply one piece of the puzzle.
Value the tiers over the scores themselves. As shown with the decision tree, success is not linear. Put more importance on the tiers instead of the numerical grade. You’ll see why in the historical wPPG table below.
Below are the tiers and grade cut-off thresholds a prospect needs to reach in order to be in that tier.

Below is the true significance behind the tiers: historical wPPG for those that fall into these tiers. It also shows how many of the 180 WRs used to create the model (2017 through 2022 draft classes) fall into place.

2025 WR Class: Pre-Draft Tiers and Grades
The reason you’re here…

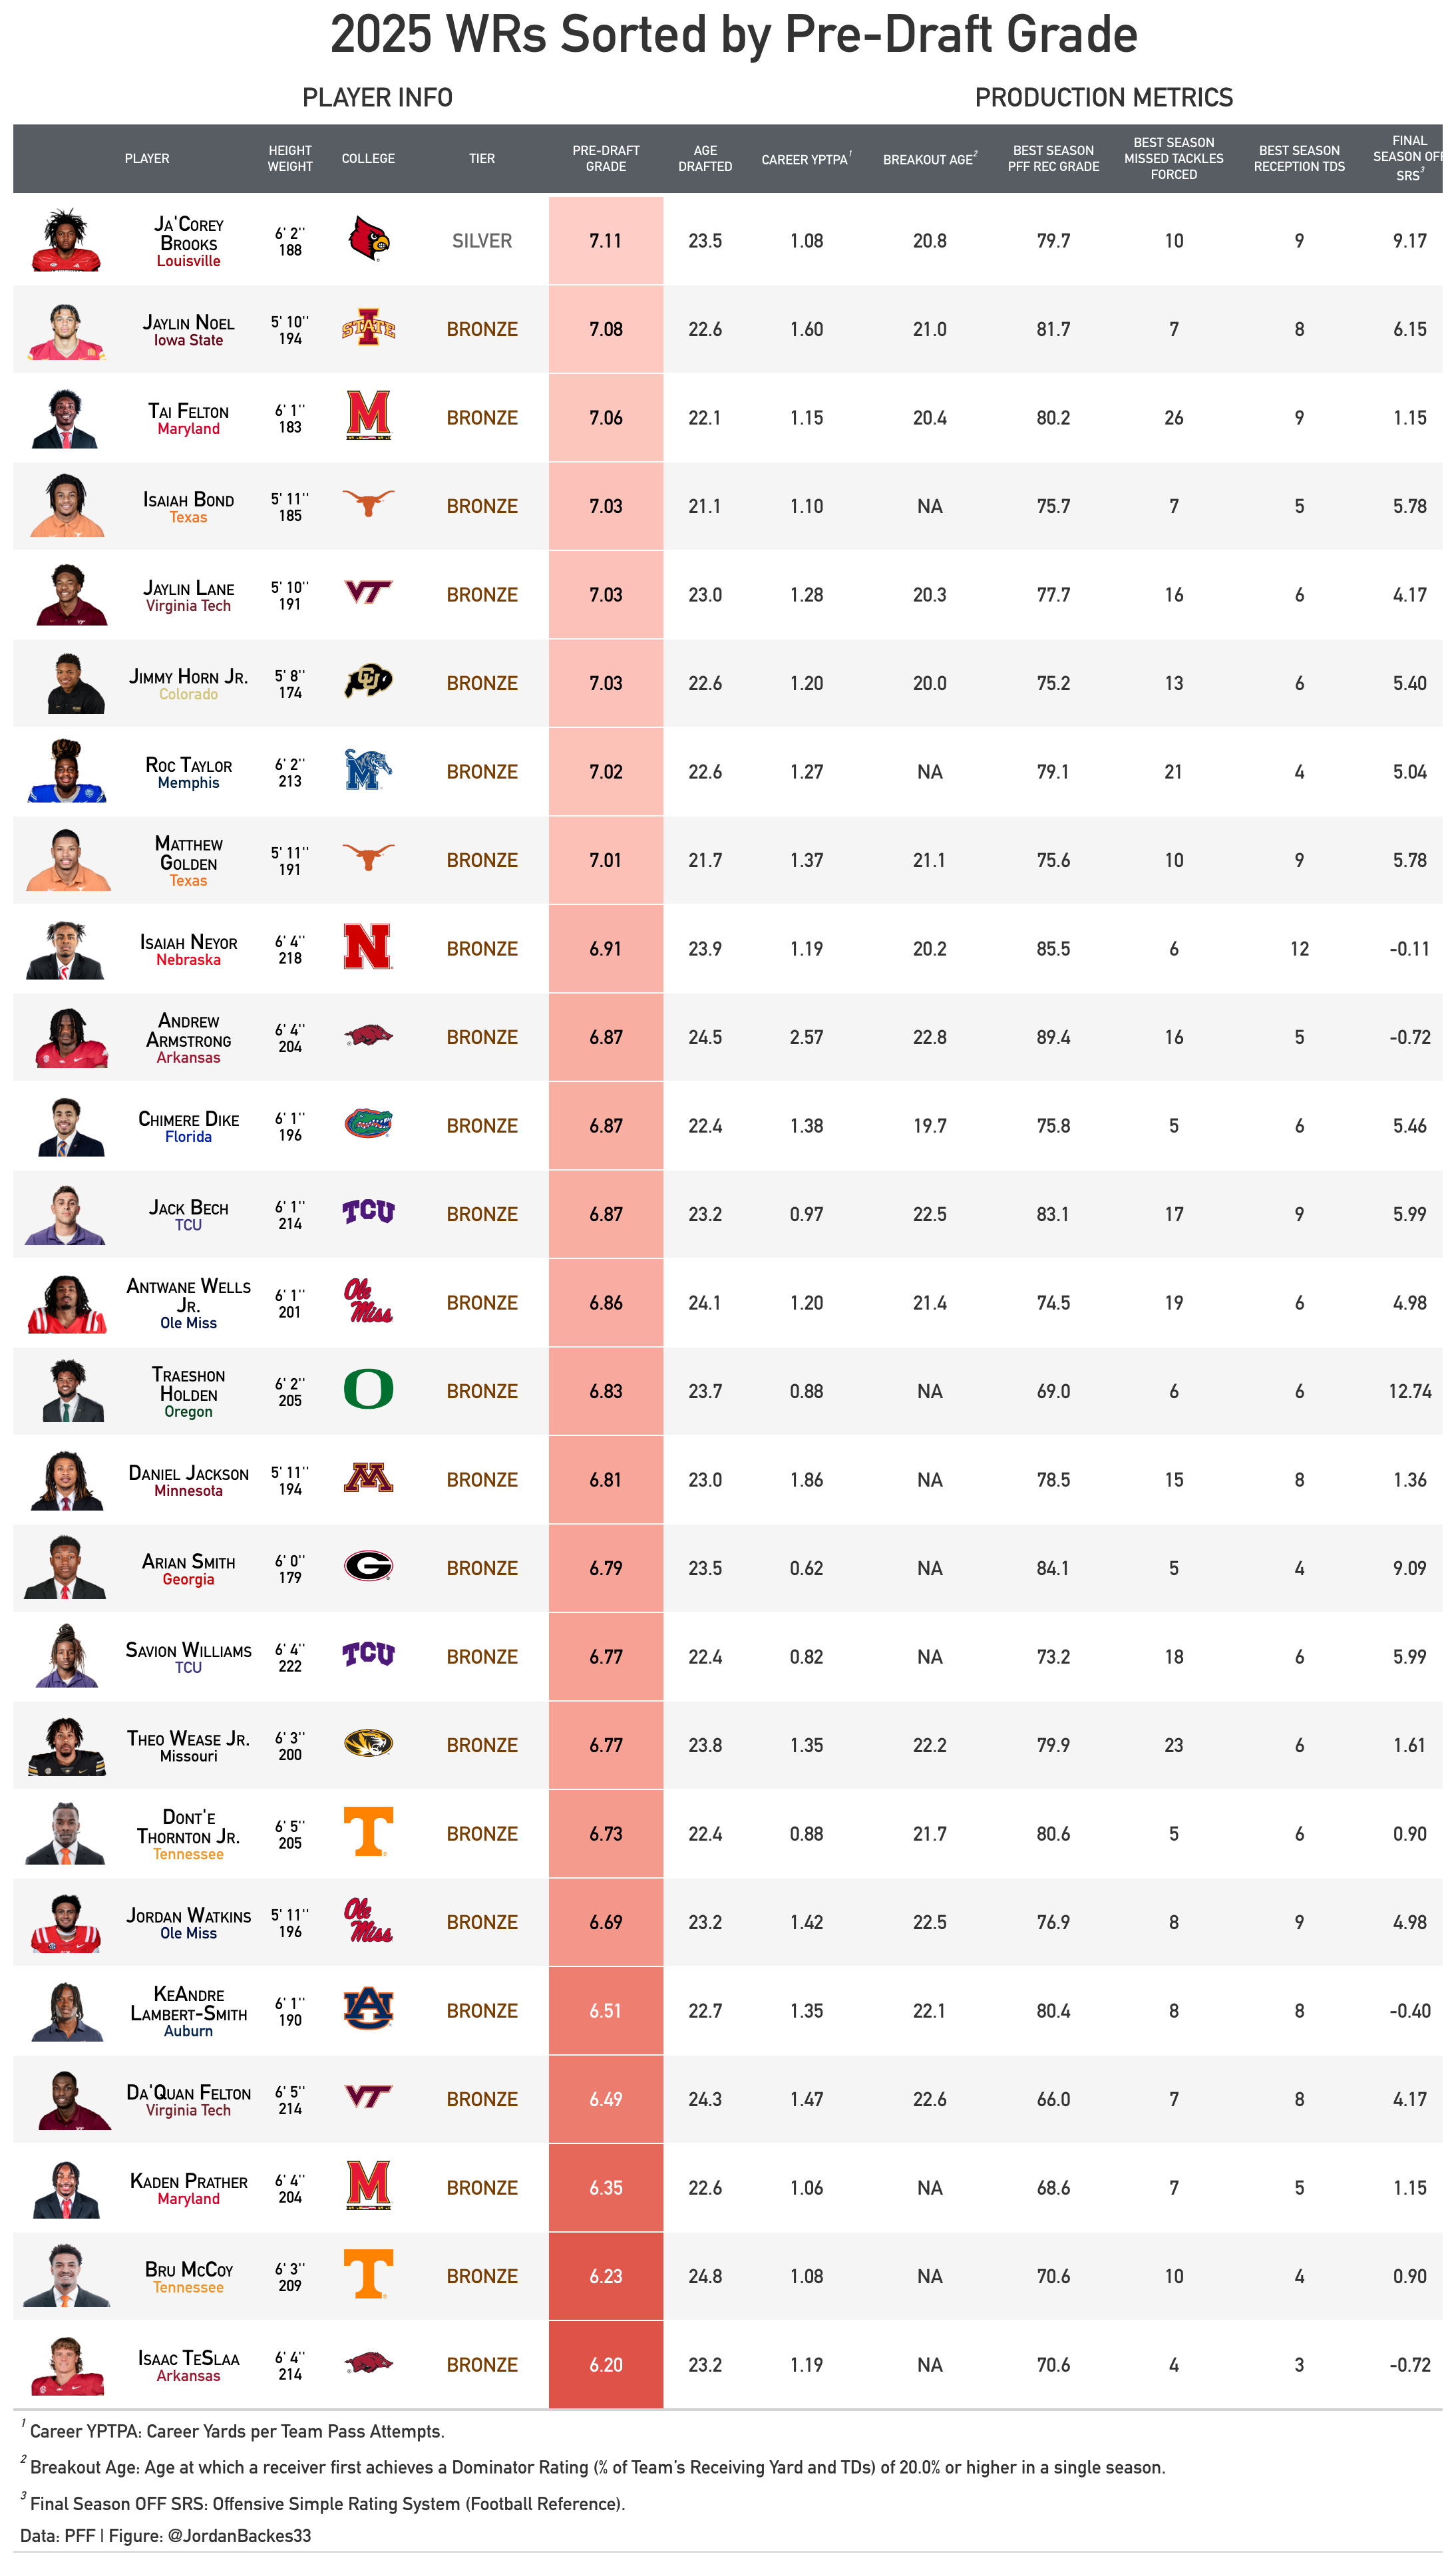
Some players that really jumped, in a bad way, out to me:
- Jalen Royals: I thought the model would like him a lot, especially with him having small school dominance.
- Matthew Golden: The NFL loves Matthew Golden after his 40-yard dash lit up the combine, but my grades say otherwise. Since 2017, only two players have been in the Bronze Tier pre-draft and been drafted in round 1 - Ricky Pearsall and Xavier Legette. Another handful were drafted on Day 2. However, out of everyone in the Bronze Tier pre-draft, only five of 63 (~8%) have gone on to have a wPPG of 8.0 or more: Hunter Renfrow (10.5 wPPG), Darius Slayton (9.6), DJ Chark (8.9), Josh Palmer (8.6), and Curtis Samuel (8.0).
Conclusion
Draft capital is a big piece of any prospect profile, but for WRs, it matters the most. With draft capital, we can add a few other metrics to improve draft capital alone. Let me know how you feel about my WR Model and enjoy the 2025 NFL Draft tonight!
Between picks, check out one of my go-to’s for all college football analytics,
. His 2025 QB Clustering post is fantastic and got my picking up an old project I worked on last year, WR Archetype Clustering (hint-hint, coming soon). ’ newsletter is a must read to any collect football analytics lover. Check out the below and make sure to subscribe to their work!
If you’ve enjoyed this and want to see more like this, including all other positions from the 2025 NFL Draft Class, please subscribe to this entirely free Substack! As always, you can also find me on X at @JordanBackes33.
Appreciate the shoutout! Luther Burden WR1 hive STAND UP