


2025 QB Class: Final Pre-Draft Grades
One Last Pre-Draft Look at the 2025 QB Class

Welcome to the first edition of The Fantasyland Forecast! I am Jordan Backes, a dynasty fantasy football data nerd and Disney fan (which is where the Substack’s name came from). I have a bit of background in statistics and want to merge that with my passion for dynasty fantasy football.
In the world of dynasty fantasy football, every edge counts. That's why I've developed an analytics model to evaluate college prospects, designed to give you that crucial advantage.
My approach goes beyond simple data aggregation. By employing predictive modeling and machine learning in R, I can identify patterns and predict future performance with a higher degree of accuracy. This allows us to move beyond conventional wisdom and uncover true potential.
A core principle of my model is statistical rigor. I pay close attention to concepts like multicollinearity to ensure the model isn't being misled by redundant information. This commitment to sound statistical practices leads to more reliable and trustworthy results.
I also believe in keeping things transparent. You deserve to know how these player grades are generated. While the underlying mechanics are advanced, I'll always strive to explain the key principles clearly and understandably.
For all positions, my model is trying to predict Weighted Points per Game (wPPG) for a player’s first three years. I am choosing to use wPPG model due to how reactionary dynasty fantasy football is becoming - if a player doesn’t perform early, managers become impatient, move on, and their value decreases. My formula for wPPG is below:
wPPG = (Yr1 PPG * 45%) + (Yr2PPG * 35%) + (Yr3PPG * 20%)
Remember, even a small yearly advantage in your dynasty league can compound significantly over time. My goal is to provide you with that edge, helping you make informed decisions that lead to long-term success. Let's dive into the data and find those future dynasty stars!
This initial posting will be much longer than the ones going forward, as this takes an in-depth look at my model and process. If you would like to just skip to the results, jump down to the “Inputs and Results” section.
The Quarterback Model’s Foundation
I analyzed players drafted from the 2017 to 2022 NFL Drafts. Each one of those players has had the opportunity to complete three NFL seasons. For the QBs, this resulted in a sample size of 66 players. I chose to only look back 5 five complete draft classes to ensure we are evolving with the NFL and, as I mentioned, “relevant” data sets.
I sifted through well over 100 metrics for each fantasy position to see which ones correlated the most with fantasy success. While it may seem like an absurd amount of numbers to examine, many metrics were variations of the same core statistic (ie, Final Season Yards per Attempt, Best Season Yards per Attempt, Career Yards per Attempt, etc). To avoid overfitting the model, I set a maximum limit of 10 metrics for each position.
Instead of forcing success based on linear improvement, I used Decision Tree Analysis to define thresholds for each input metric. An example of this is shown below in a QB’s Overall Draft Selection tree.

Think of Decision Tree Analysis like a "20 Questions" game. We start at the top of a flow chart and answer yes or no to different questions about a player until we land on a final score.
Take Sam Howell, drafted way back at pick 144. We start by asking: "Was his draft spot 59th or later?" Yes. So, we follow the "yes" path (left). Next question: "Was he drafted 193rd or later?" Nope. So, we go the "no" path (right). Last one: "Was he drafted before pick 136?" Nope again. Down the "no" path, we hit 5.7 wPPG. That's what the draft spot alone tells us to expect for his early career fantasy points.
Now, here's where it gets a little quirky, and why Howell's a good example. Notice that last question: "drafted before 136?" You'd naturally think earlier picks (lower numbers) should predict a higher wPPG, right? But this part of the chart suggests otherwise. That's likely because a few later-round guys (like Bailey Zappe, Howell himself, and Gardner Minshew) actually did okay and are skewing this one a bit. For these weird spots, I skip over that specific question and group those areas together.
Once I've built the decision tree and evaluated break-points, I give the best outcome a score of 9 and go down from there. So, for QBs and their draft spot: Top 14 picks get a 9, picks 15-58 get an 8, picks 59-192 get a 7, and everyone else gets a 6.
This decision tree approach helps us see that player success isn't always linear. Sometimes, a guy with a 9.2% target share can be just as good for fantasy as someone with 10.1%.
After scoring every player on every important stat this way, I use an optimized weighted average to get a final grade. To make sure one stat doesn't overpower everything, I limit any single stat's influence to 20%.
Lastly, using decision tree analysis once again, I create tiers for players based on their expected fantasy points: Diamond, Platinum, Gold, Silver, and Bronze.
The real test? Seeing if my grades do a better job of predicting future fantasy points than just looking at where a guy was drafted. If my model’s R-squared (R2 - a measure of fit for a given model) for predicting wPPG beats the R2 of NFL Draft Capital for predicting wPPG, then I did my job. If not, you might as well just pick players based on where they were drafted.
Inputs and Results
For QBs, I used 10 input metrics across four different categories:
Individual Performance
Best Season ESPN QBR
Breakout Age
Best Season PFF OFF Grade
Best Season Rushing Yardage Share
Final Season Adjusted Completion Percentage (PFF)
Career Big Time Throw to Turnover Play Ratio
Team Performance
Best Season Offensive Simple Rating System (Sports Reference)
Athletic Measurable
Relative Athletic Score (RAS)
Biographic Information
Age Drafted
Overall Draft Selection
As previously mentioned, we will be comparing my model’s R2 for predicting wPPG to the R2 of NFL Draft Capital for predicting wPPG. R2 is measured from 0 (poor fit) to 1 (perfect fit). The goal is to beat NFL Draft Capital, not find a perfect fit. Results are below for Overall NFL Draft Selection and all of my grades (Pre-Combine, Pre-Draft, and Post-Draft)
Overall NFL Draft Selection vs Years 1-3 wPPG: .386 R2
Pre-Combine Grade vs Years 1-3 wPPG: .613 R2
Pre-Draft Grade vs Years 1-3 wPPG: .654 R2
Post-Draft Grade vs Years 1-3 wPPG: .706 R2
Every step of the way, my grades outscored the Overall NFL Draft Selection.
Tiers and Grades
Now that we have determined that the model is worth looking at for QBs, let’s dive deeper into the grades, tiers, and the significance behind them.
Two things to note:
These are NOT my rankings. These are simply one piece of the puzzle. Yes, the results show that these do pretty well, especially for QBs, but there is more to the prospect puzzle than just these grades.
Value the tiers over the scores themselves. As shown with the decision tree, success is not linear. Put more importance on the tiers instead of the numerical grade. You’ll see why in the historical wPPG table below.
Below are the tiers and grade cut-off thresholds a prospect needs to reach in order to be in that tier. Unlike the other positions, QBs only have four tiers, as there was no significant difference below grades of 7.38.
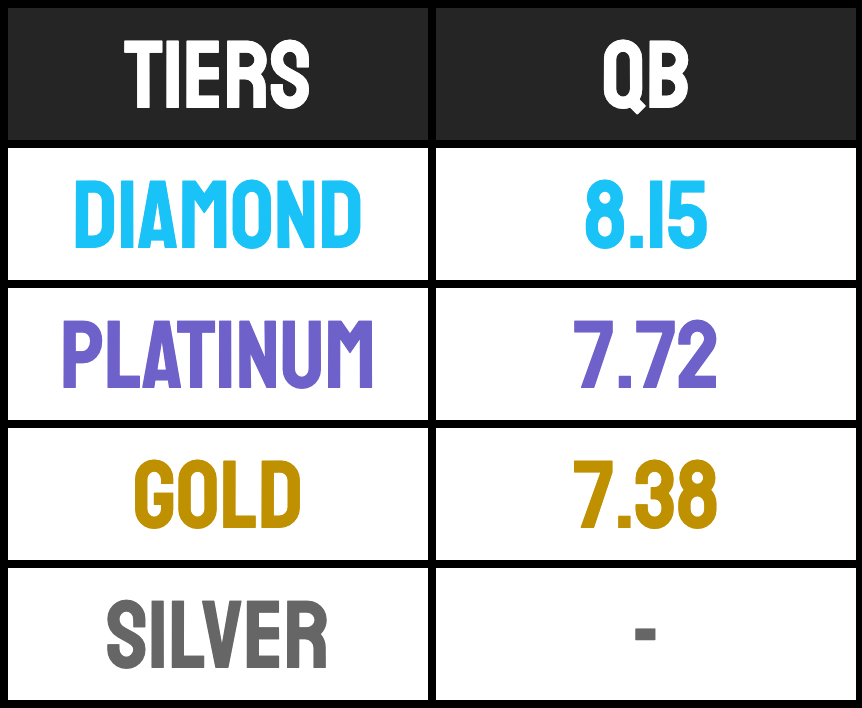
Below is the true significance behind the tiers: historical wPPG for those that fall into these tiers. It also shows how many of the 66 QBs used to create the model (2017 through 2022 draft classes) fall into place.

2025 QB Class: Pre-Draft Tiers and Grades
The reason you’re here…

Conclusion
We are obviously missing one crucial piece of information: NFL Draft Capital. Once this upcoming weekend passes, I will be updating my model for the 2025 QBs and sending out an update. I will also be including historical grades and tiers, as well as Class Breakdowns for all classes, showing where this 2025 QB class falls amongst current NFL QBs.
If you’ve enjoyed this and want to see more like this, including all other positions from the 2025 NFL Draft Class, please subscribe to this entirely free Substack! As always, you can also find me on X at @JordanBackes33.